
Designing and launching a virtual cards landing page
A mixed-methods usability and competitor study to help a Fortune 500 financial institution teach customers what a virtual card is, and why they should set one up.
Virtual cards are a brand-new idea for most customers. A Fortune 500 financial institution was launching one centralized “hub” landing page for its virtual card numbers (VCNs) and wanted to know whether the page actually explained the product, built enough trust, and moved people to act.
My Role
I helped plan and run the research from the first client conversation through the final readout: aligning on goals, wireframing the page, designing the study, recruiting, moderating 10 sessions, synthesizing, and handing off prioritized recommendations.
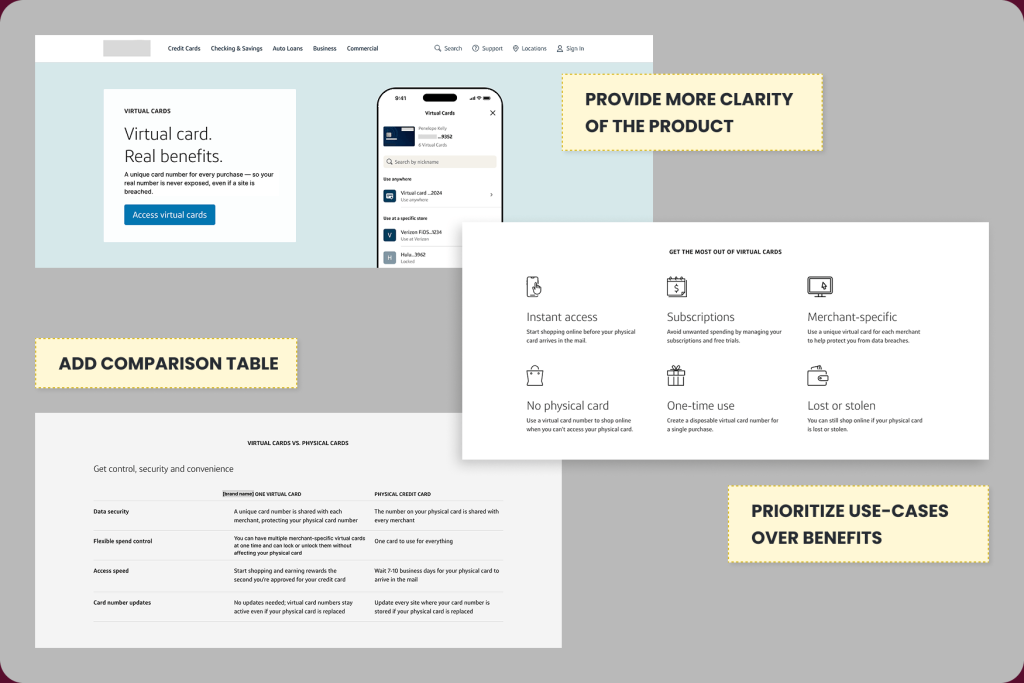
The short version: the page had the right content in the wrong order. Customers loved the use cases, but the product was never defined before the first calls to action, and the strongest content sat below the fold.
Project Details
- Client: Digital Tools Marketing Department at a Fortune 500 financial institution
- Timeline: February to August 2026 (sessions held June 1 to 10, 2026)
- Role: User Experience Lead
- Methods: Wireframing, moderated usability testing (10 participants), first-impression testing, scenario-based think-aloud, competitor benchmarking
- Deliverables: Wireframes and content outline, research plan, screener and discussion guide, readout deck, annotated page designs
- Collaborators: A UX Strategist, the SEO and Content teams, and the client’s product marketing team
The Process at a Glance
1. Align
Met with the client on 2026 priorities, pitched research ideas, and got one approved.
Output: approved research direction
2. Wireframes
Built wireframes from the client’s component library, defined content hierarchy, iterated through three rounds of client feedback.
Output: wireframes and content outline
3. Plan
Wrote the research plan, screener, and discussion guide; proposed two timeline options and success metrics.
Output: research plan and discussion guide
4. Recruit and Test
Recruited 10 customers; ran 90-minute moderated sessions.
Output: session recordings and notes
5. Synthesize and Deliver
Synthesized with the UX Strategist; built the readout.
Output: readout deck and prioritization matrix
6. Hand Off and Measure
Shared insights across design, marketing, and product; planned a pre/post analysis.
Output: measurement plan
The Problem
The client’s earlier research (and a separate third-party study) had already shown three barriers to adoption: customers default to habitual ways of paying online, they have no frame of reference for virtual card numbers, and they don’t understand the benefits or how cards are created and managed. A previous 2025 emerging payments research study our team ran, found the same thing. People liked the ideas of security, convenience, and control, but were unclear on what a virtual card is, how to access one, and how it beats a physical card.
The new landing page was meant to fix that. My job was to find out whether it did, before more traffic was pointed at it.
What we set out to learn
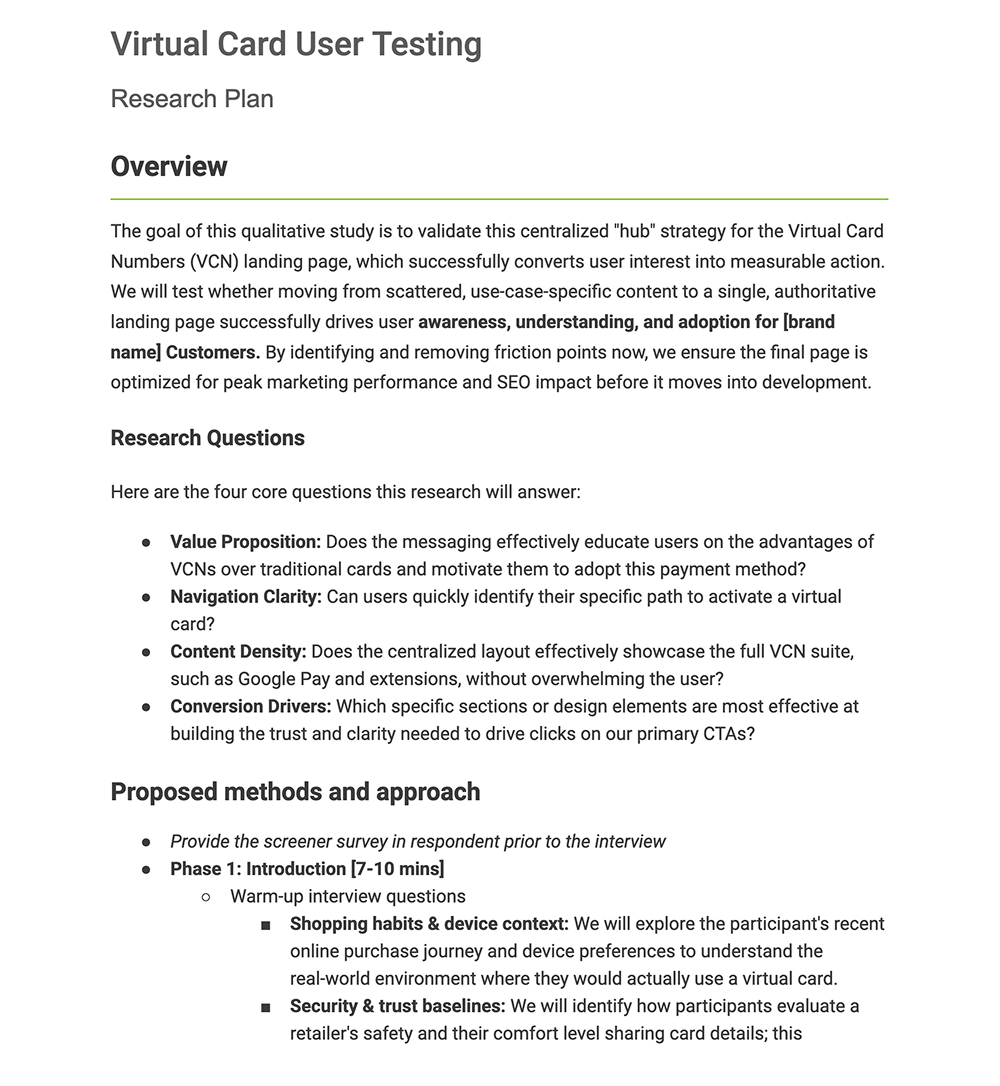
- Value proposition: Does the messaging educate customers on the advantages of virtual cards and motivate them to adopt?
- Navigation clarity: Can users quickly find the path to activate a virtual card?
- Content density: Does one page showcase the full suite without overwhelming people?
- Conversion drivers: Which sections build the trust and clarity needed to drive clicks on the primary CTAs?
My Approach
Step 1: Align on what we could influence
The client’s priorities for 2026 were clear, and so were their constraints. Our team would not be part of the creative process, and we could not test wireframes before the client’s creative team started on the design. So I pitched research that focused on what we could control and got approval to test the final mockup once it was ready.
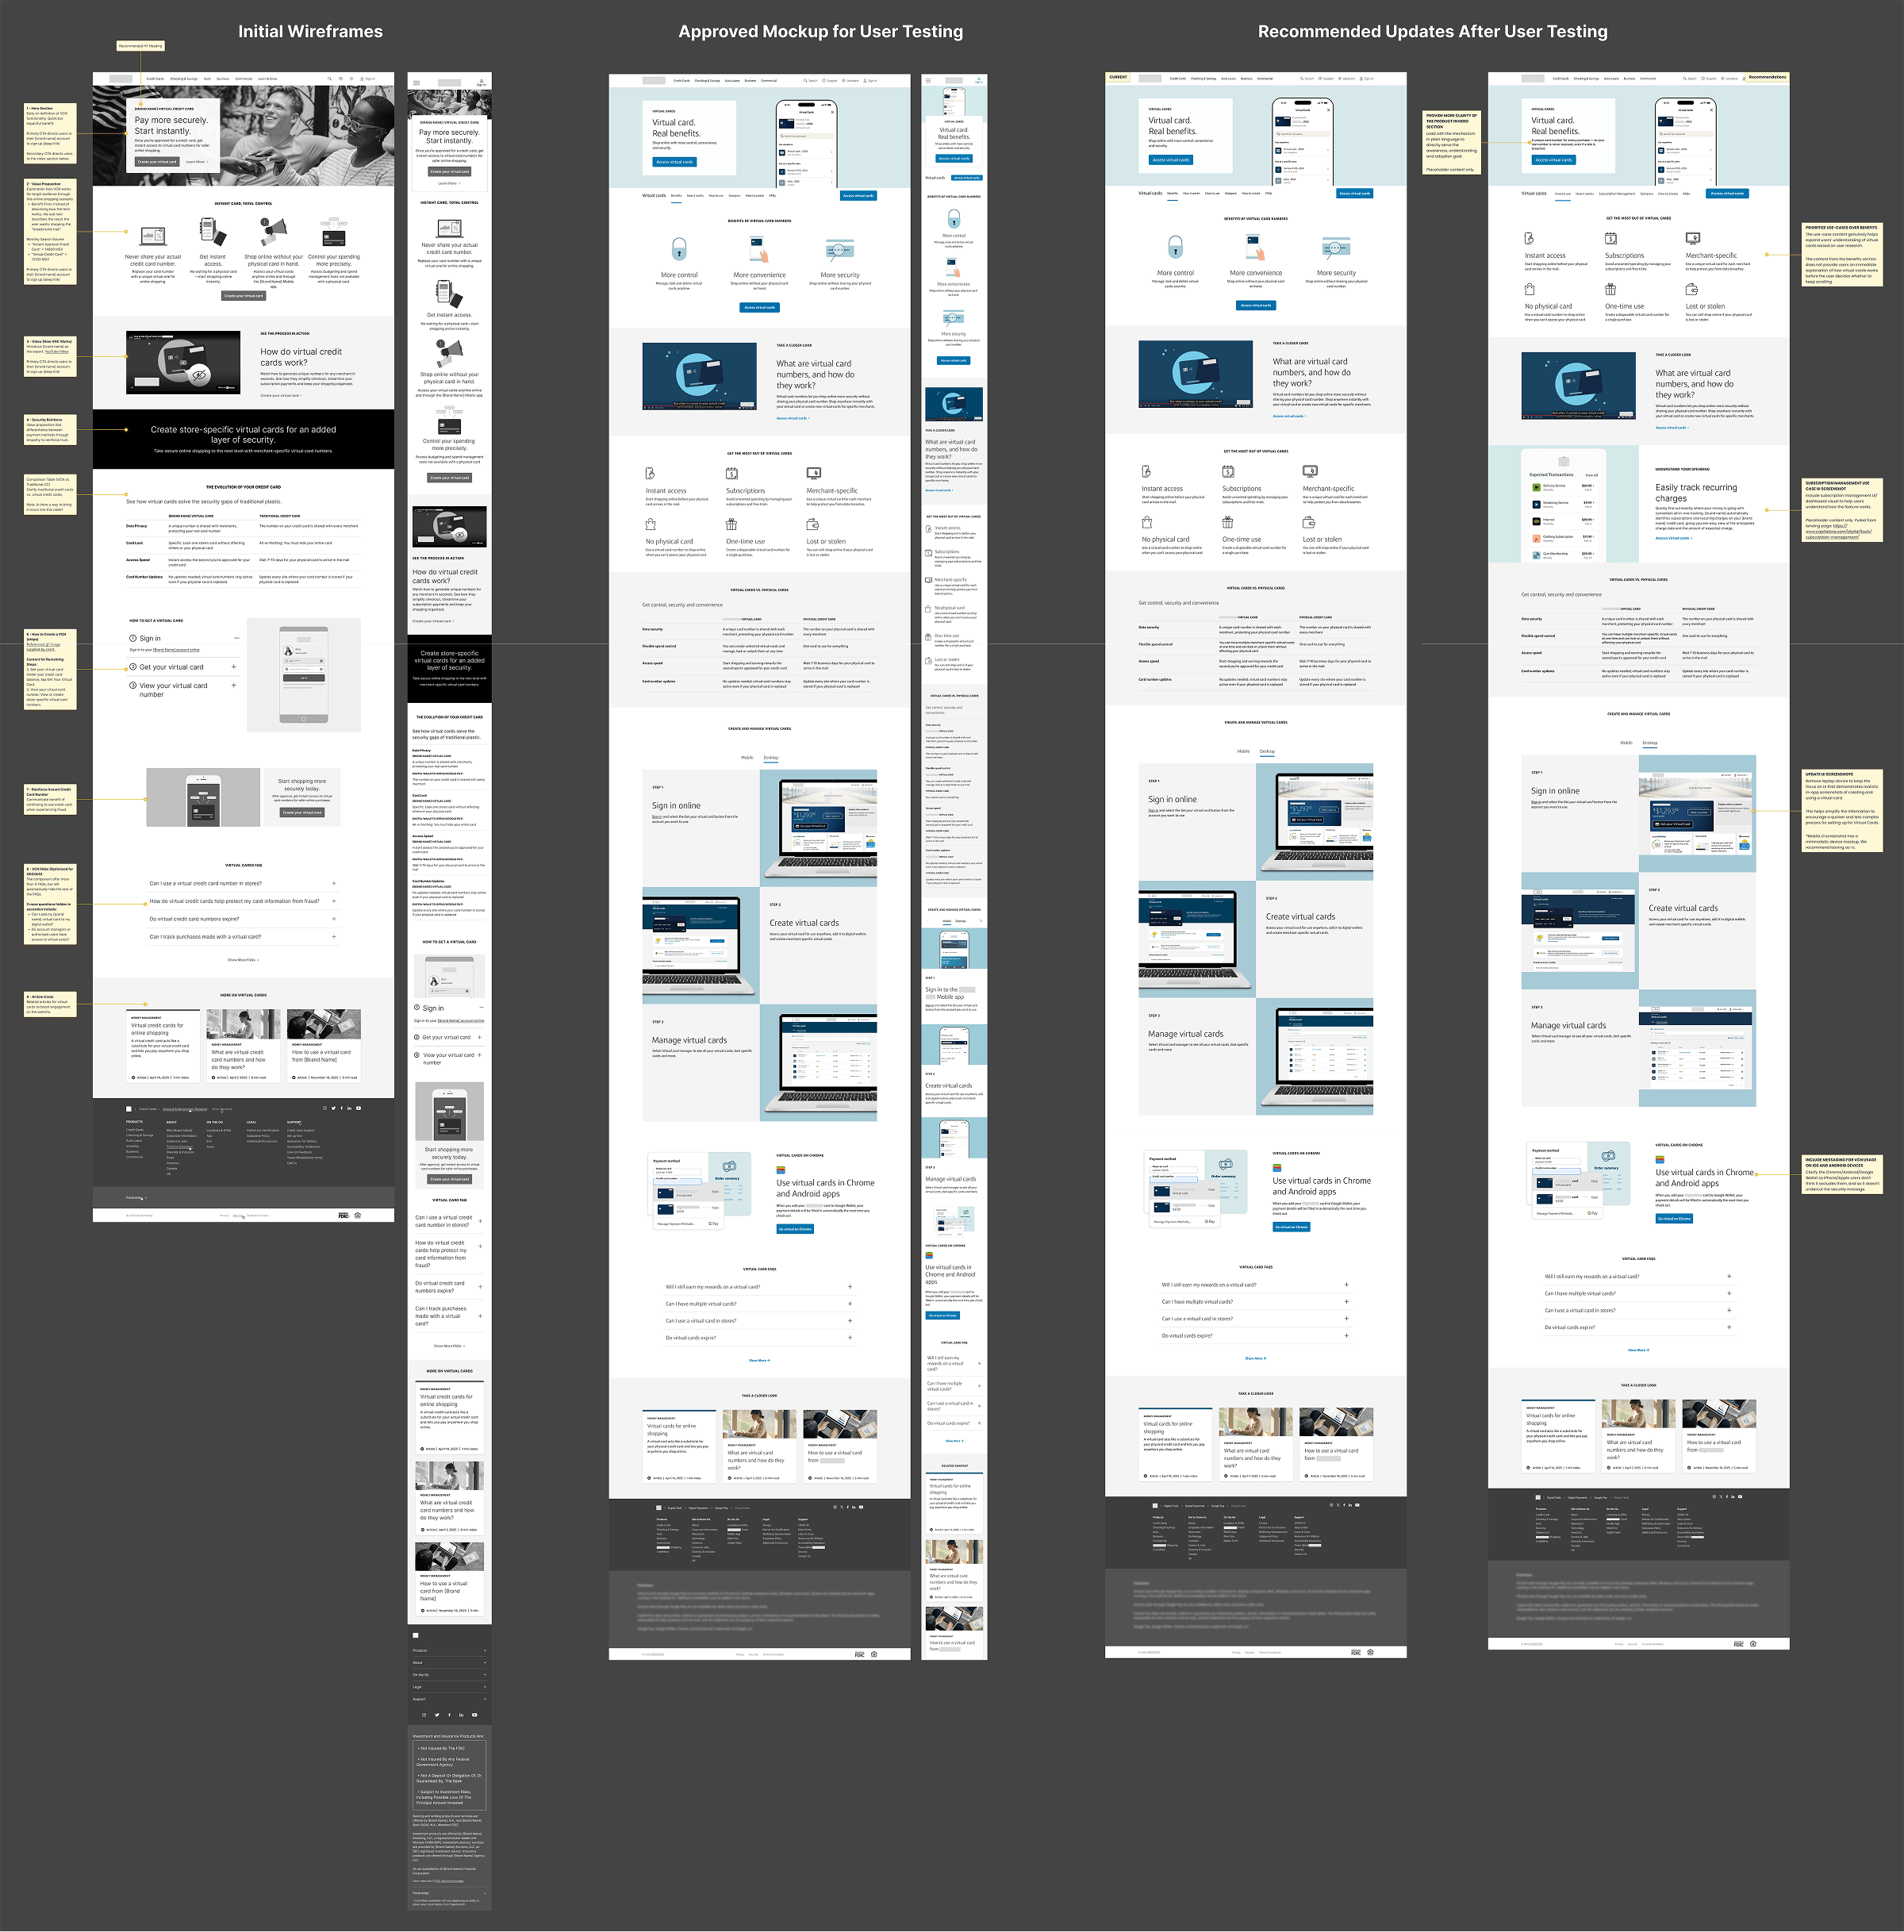
Step 2: Wireframe the content hierarchy
While waiting on creative, I used the client’s component library to wireframe the page and a content outline so the SEO and Content teams could start writing. The content didn’t fit the components one to one, so I used AI (Gemini) to generate placeholder copy that communicated the goal of each section. That let me deliver wireframes much faster and kept the review focused on structure.
The hierarchy decisions were grounded in evidence:
- Security and instant issuance at the top. Security was a top concern in the client’s prior research, “instant credit card” was a competitor keyword our SEO team had flagged, and receiving a card number instantly during a fraud event was a scenario the client raised at kickoff.
- Comparison table kept. The client found it text heavy. I kept it because our 2025 research showed users want these differences spelled out, our AI Overview format analysis showed tables are more likely to be cited for comparison queries, and a third-party study recommended charts that feel modern and lightweight.
- Changes from client feedback. Added a sticky nav with a main CTA, turned use cases into their own section (slider, then illustration cards), consolidated the “how to get a card” steps into three steps, and moved the Google Pay section above the FAQs.
Step 3: Design the study
I wrote the research plan, screener, and discussion guide with the UX Strategist. The screener recruited:
- Participants: 10 active cardholders, ages 20 to 60, who shop online at least 1 to 3 times a month, from a wide range of job functions (excluding marketing and finance professionals to reduce bias)
- Device split: 5 mobile-primary and 5 desktop-primary, each testing the matching prototype
- Payment habits: 5 “manual typers” and 5 wallet/autofill users
Each 90-minute moderated session had four parts:
- Warm-up: shopping habits, security and trust baselines, and what people already believed a virtual card was
- First impressions: a 20-second scan of the page, then “what caught your eye first?”
- Scenario-based think-aloud: “You’re about to buy a gift from a website you’ve never used. Review this page and tell me if anything seems worth setting up today.”
- Competitor benchmarking: 60 seconds each on Revolut, Discover, and American Express virtual card pages, followed by the same questions
Step 4: Plan around the launch
The launch date didn’t leave room for testing first. I proposed two plans: Plan A delivered findings June 16 and left two weeks to implement before launch, and Plan B launched the client’s final design and implemented recommendations about 30 days later, which also set up a clean 30-day pre/post comparison. The client launched first and implemented insights after, so the study became a way to improve a live page rather than gate it.
I also drafted a measurement framework for internal use (it wasn’t sent to the client), covering: CTA click-through by segment, downstream activation within 7 to 30 days, scroll depth, FAQ and tab interactions, sticky nav usage, and heatmaps and session recordings.
User Interviews
Participants reviewed the prototype on their primary device while thinking aloud, then saw the three competitor pages. A few moments that shaped the findings:
Participant, on the hero and CTA
“The access of virtual cards is right here, and then the access for virtual cards is also right here, which is a little redundant.”
Participant, on convenience vs. security
“When I think of virtual cards, I think of convenience. I didn’t know about the security piece.”
Participant, on use case placement
“If it’s something I could have found without scrolling, it would have been better for my use.”
The Findings
Core insight: Customers weren’t rejecting the page. The content was strong, but its order and wording made a new product harder to understand than it needed to be.
What worked
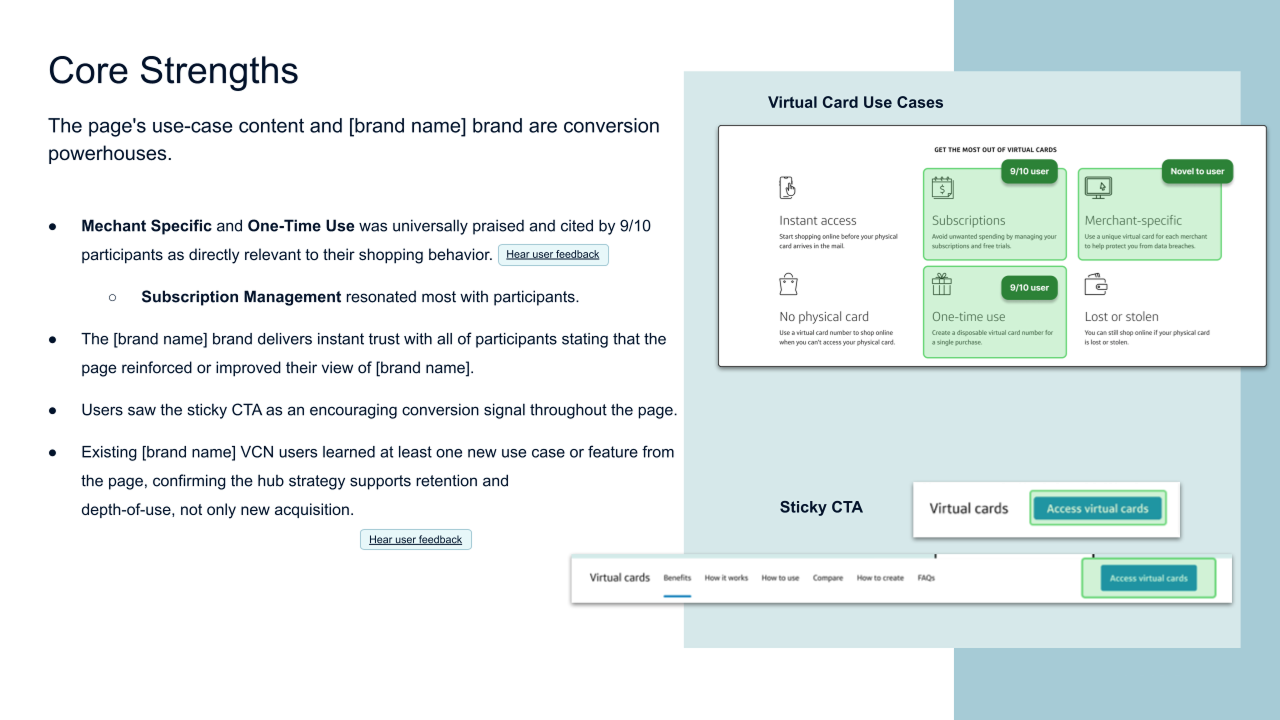
- Use cases were the strongest asset. Merchant-specific and one-time-use cards were relevant to 9 of 10 participants, and subscription management resonated most.
- The brand built trust. Every participant said the page reinforced or improved their view of the company.
- The sticky CTA read as an encouraging signal while scanning.
- Existing virtual card users still learned something new, which showed the hub supports depth of use, not only new acquisition.
Friction points
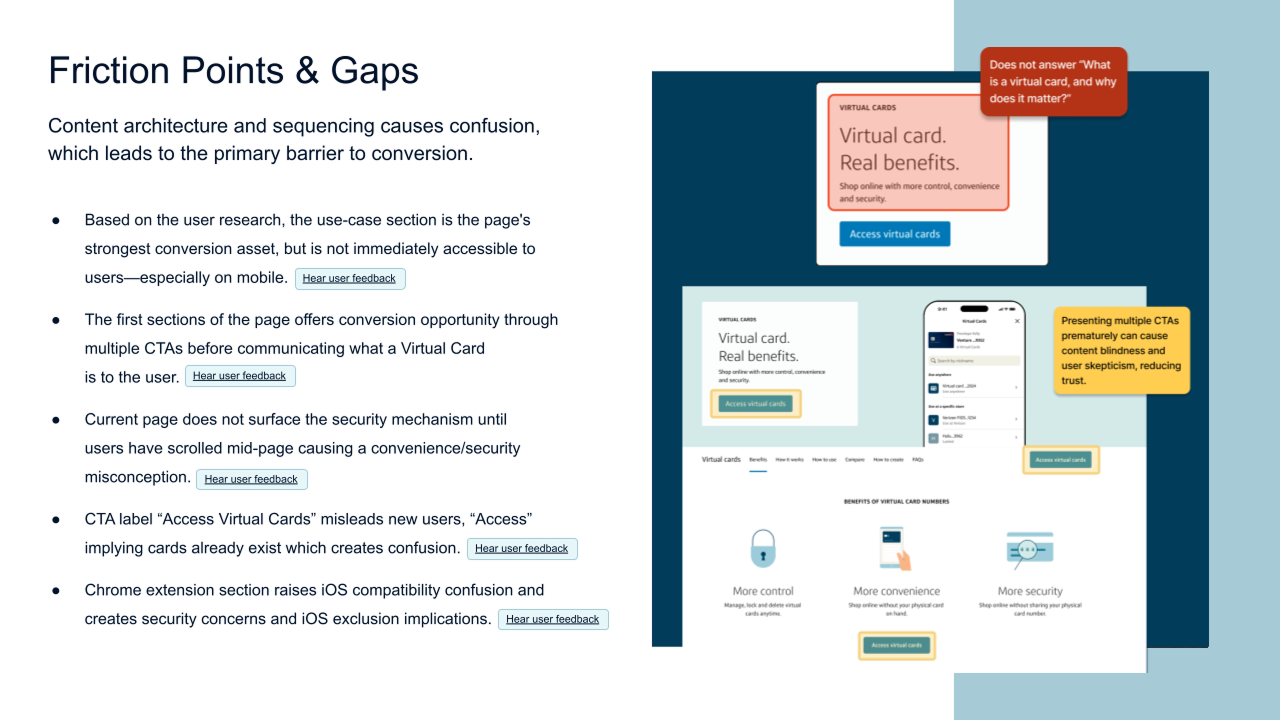
- Sequencing. The first sections offered multiple CTAs before explaining what a virtual card is. Use cases helped people understand the product, but sat too low, especially on mobile.
- Security vs. convenience. The security mechanism didn’t appear until mid-page, so people assumed virtual cards were about convenience.
- CTA label. “Access Virtual Cards” implied the cards already existed, which confused new users and read as “manage” rather than “create.”
- Browser extension section. Showing Android and Chrome raised questions about iPhone compatibility and whether a browser connection was another security risk.
- Steps screenshots. The setup flow looked longer than it was. One participant who had set up a virtual card said it was far easier than the page made it seem.
What competitors taught us
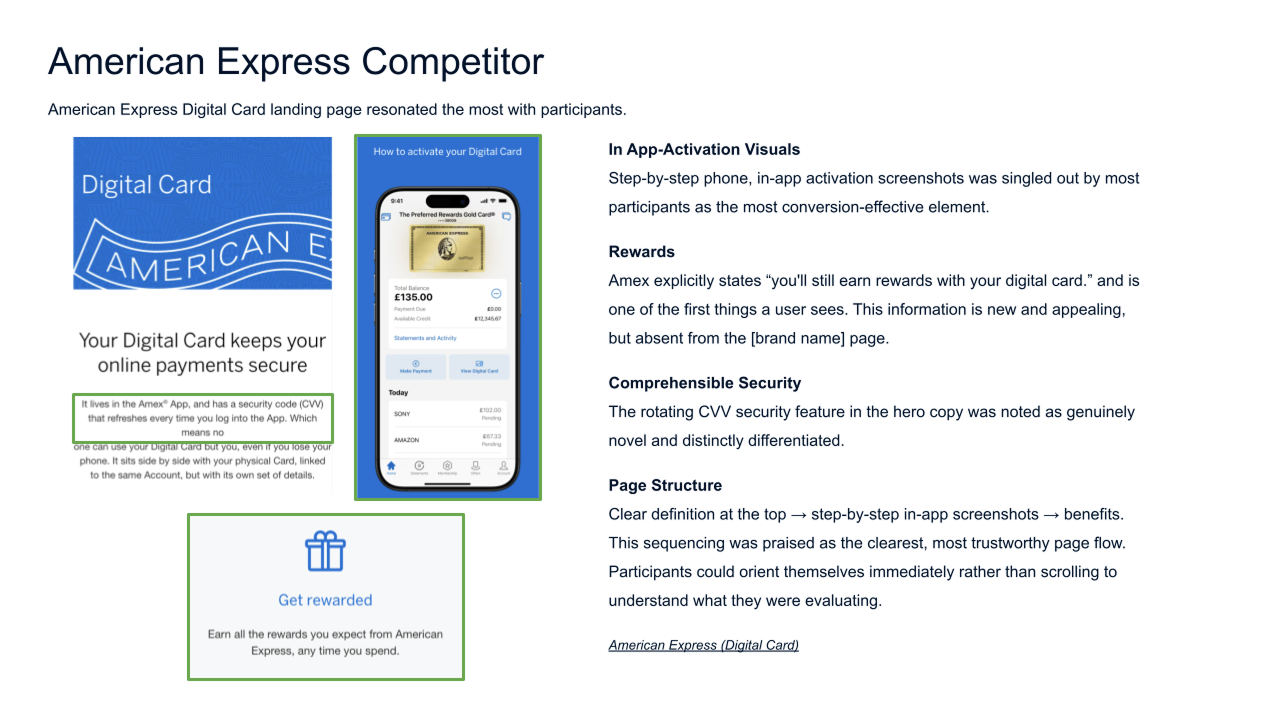
- American Express. What resonated: step-by-step in-app screenshots, rewards continuity (“you’ll still earn rewards”), a clear definition at the top, and the rotating CVV feature. What didn’t: n/a.
- Revolut. What resonated: modern 3D visuals and the breakdown of disposable and multi-use cards. What didn’t: a playful tone that felt unprofessional for finances, and a UK web address banner that created doubt.
- Discover. What resonated: standalone trust signals such as dark web alerts and 24/7 human support. What didn’t: cluttered layout, interchangeable terminology, and a push toward new applications instead of existing customers.
The American Express page had the clearest flow: definition, then steps, then benefits. That became the model for the recommendations.
The Output
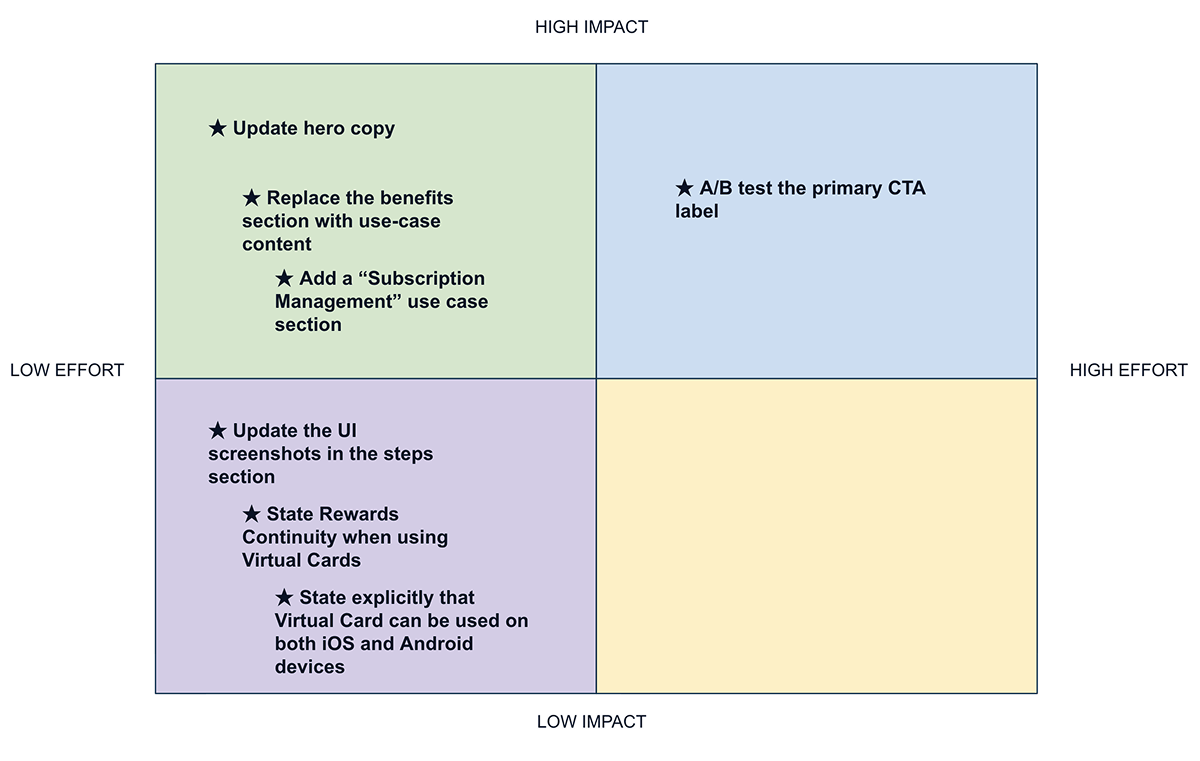
I delivered a readout deck and annotated page designs with seven prioritized recommendations:
- Rewrite the hero in plain language so the page explains what a virtual card is and how it protects you before anything else.
- Replace the benefits section with use cases so people understand the product before they decide to keep scrolling.
- Add a “Subscription Management” section with a real UI visual, since people need to see how it works.
- A/B test the primary CTA, such as “Get My Virtual Card” or “Create a Virtual Card,” against the current label.
- Simplify the setup screenshots to show a quicker, less complex process (and drop the laptop mockup on desktop).
- State rewards continuity explicitly: purchases earn the same rewards as the physical card.
- State that it works on both iOS and Android, and explain the Chrome connection, with clearer information on how autofill storage is secured.
I plotted each on an impact and effort matrix so the team could decide what was feasible given implementation and legal constraints.
What Happened Next
The page launched at the end of June, before the findings were ready to be applied. In late July, the client moved the use case content higher on the page, which matched our top finding. In August, the marketing manager shared the insights with design, marketing, and product, and they were well received. The client plans to implement the remaining recommendations at the beginning of next year, giving them enough baseline data to run a pre/post analysis.
Early performance of the launched page
These numbers describe the page as launched, not the effect of the recommendations, which haven’t shipped yet. They are directional rather than causal:
- 15,373 organic search visits in the first three months
- 7,966 CTA clicks from organic search (70.6% CTR)
- 12% bounce rate, the lowest of the client’s emerging payment landing pages
- 103 AI Overview citations to the page by end of Q3, and +0.95 points of share of voice quarter over quarter
One caveat: internal links were sending some users to other virtual card articles instead of this page, which may understate its performance.
What I’d Measure
If I were driving the strategy, I’d run a 30-day pre/post analysis on the changes once they ship, tracking:
- Conversion: CTA click-through, split by existing customers vs. new prospects; downstream activation within 7 to 30 days
- Engagement: scroll depth to the how-to steps, FAQ and tab interactions, sticky nav usage, time on page
- Experience: click heatmaps to catch people tapping non-interactive elements; session recordings for hesitation and rage clicks
Challenges
- Testing without controlling the design. We couldn’t test wireframes and weren’t part of the creative process, so I tested the final mockup and focused recommendations on content, sequencing, and copy.
- A tight timeline. The page needed to launch before findings could be applied, so I framed the research as an optimization plan with a clear way to measure it.
- A late legal review. Recruitment paused while legal reviewed the page, which led to disclaimer and copy updates we had to reflect in the prototype.
- Small samples. With 5 participants per device, findings are directional, which is why I recommended an A/B test for the CTA.